Friday night we got 2.4 inches of snow at home, after a storm earlier in the week dropped a total of 6.9 inches of snow (0.51 inches of liquid). I plowed the road on Wednesday afternoon after most of that first storm’s snow had fallen and got up Saturday morning debating about whether I should plow again. My normal rule is if we get more than two inches I’ll plow, but I didn’t feel like it and left it. It’s snowing again today, so I will probably wind up plowing soon.
Feeling somewhat responsible for keeping the road clear makes winter something of a mixed bag for me because I enjoy the snow in the winter, but the drudgery of plowing turns snow storms into work. I remember plowing three times in the span of a week before Thanksgiving one year, and everyone in Fairbanks remembers Christmas 2021 when we had a major storm with both rain and snow, following by extreme cold, and most people were stuck at home until they could dig out. Our four wheeler was out of commission with a burned up rear differential, so I couldn’t do anything about it.
I thought it would be interesting to look at the storm data for Fairbanks. I’m defining a “storm” as any period with one or more consecutive days with precipitation, and by “precipitation” I mean either rain, or the liquid when daily snowfall is melted. I am not including “trace” precipitation (snowfall less than a tenth of an inch or liquid less than 0.01 inches) in this calculation.
Here’s a table of the top ten storms in Fairbanks, ranked by total precipitation.
| Rank | Start | Days | Total Snow (inches) | Total Precip (inches) | Per Day Snow | Per Day Precip |
|---|---|---|---|---|---|---|
| 1 | 1967‑08‑08 | 8 | 0.00 | 6.15 | 0.00 | 0.77 |
| 2 | 2003‑07‑26 | 11 | 0.00 | 4.57 | 0.00 | 0.42 |
| 3 | 1937‑01‑18 | 12 | 38.15 | 4.17 | 3.18 | 0.35 |
| 4 | 1990‑07‑07 | 7 | 0.00 | 3.98 | 0.00 | 0.57 |
| 5 | 2021‑12‑25 | 5 | 23.39 | 3.67 | 4.68 | 0.73 |
| 6 | 2019‑07‑28 | 11 | 0.00 | 3.59 | 0.00 | 0.33 |
| 7 | 2014‑06‑30 | 3 | 0.00 | 3.37 | 0.00 | 1.12 |
| 8 | 1948‑07‑18 | 7 | 0.00 | 3.18 | 0.00 | 0.45 |
| 9 | 1932‑08‑02 | 7 | 0.00 | 3.14 | 0.00 | 0.45 |
| 10 | 1962‑08‑25 | 6 | 0.00 | 3.09 | 0.00 | 0.52 |
A couple storms stand out to me. First, the Christmas 2021 event is 5th on the list (it winds up 13th on the list of winter storms ranked by total snowfall instead of liquid precipitation). It’s so high on this list because a significant amount of the total precipitation in that storm came as rain.
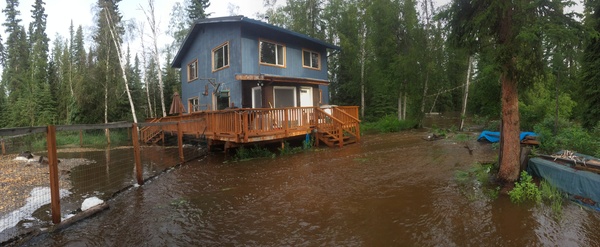
The other remarkable storm for me is the three day rainstorm that started on June 30th, 2014 and ended on July 2nd. We got a remarkable 1.12 inches of rain per day over those three days, and on July 2nd Goldstream Creek went over the banks at our house. Here’s a ranking of storms by average daily precipitation.
| Rank | Start | Days | Per Day Precip (inches) |
|---|---|---|---|
| 1 | 2014-07-07 | 1 | 1.13 |
| 2 | 2014-06-30 | 3 | 1.12 |
| 3 | 2014-09-01 | 2 | 1.12 |
| 4 | 1953-06-24 | 1 | 1.08 |
| 5 | 1992-07-06 | 1 | 0.95 |
The top three storms are all from the summer 2014.
There is evidence that one of the consequences of climate change in Alaska is an increase in the severity of storms. Here’s a ranking of the number of top 50 storms in each decade. The previous decade leads the list, and our current decade already has 2 such top 50 storms. Changing the minimum ranking from top 50 to top 100 doesn’t change the list much, and 2010‒2019 is a the top of that ranking as well.
| Decade | Number of Top 50 Storms |
|---|---|
| 2010‒2019 | 9 |
| 1920‒1929 | 7 |
| 1930‒1939 | 7 |
| 1940‒1949 | 6 |
| 1960‒1969 | 4 |
| 2000‒2009 | 4 |
| 1990‒1999 | 3 |
| 1910‒1919 | 2 |
| 1950‒1959 | 2 |
| 1970‒1979 | 2 |
| 1980‒1989 | 2 |
| 2020‒2023 | 2 |