 Ugh, it's 13 degrees F outside, and is supposed to be above freezing later. We're up watering the dogs on our way to our own breakfast. Andrea goes out sixth in the six dog, starting at 9 AM and Bonnie is third in the eight dog class, which starts at 11.
 We're in Tok now, getting ready for the draw. It was an uneventful drive down, except that the truck seems to have zapped our GPS. Doesn't turn on. Bummer.
The photo on the right in our room at the Snowshoe Motel.
We're in Tok now, getting ready for the draw. It was an uneventful drive down, except that the truck seems to have zapped our GPS. Doesn't turn on. Bummer.
The photo on the right in our room at the Snowshoe Motel.

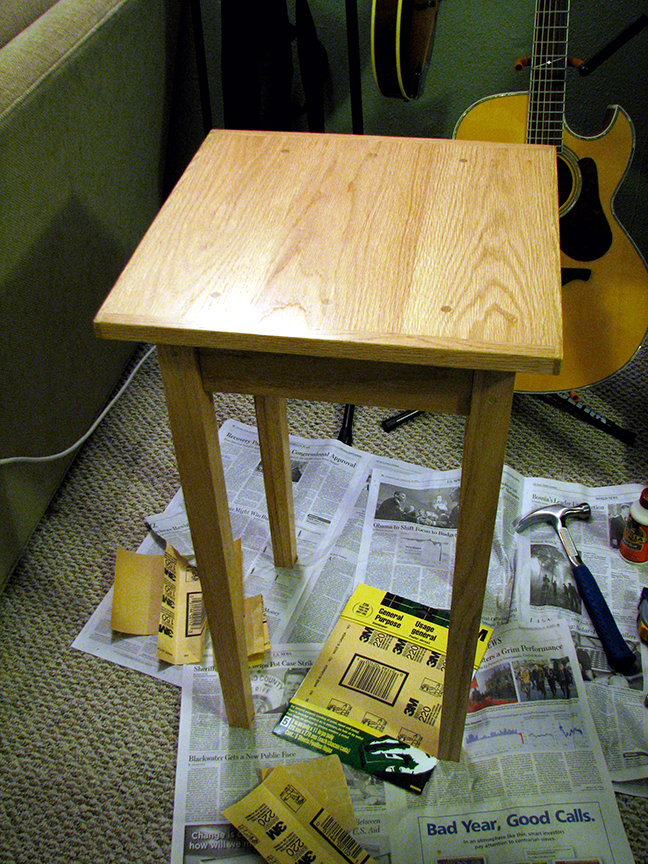
A couple days ago I got an email and the photo on the right from a guy named Nathan in Chatanooga. He’d seen my bedside table plans from the Plans page on my web site and decided to make a version of it for his wife’s birthday. His version is made from red oak, and it looks great.
It’s always great to hear from people who have found something useful at my site.
$ date +%s
1234576750
If you have no idea what I'm talking about and you're using a computer with an enlightened command-line interface, this:
$ man datemay help explain it. Or not.

Deuce, Shadow Country, Gob’s Grief
I just finished a pair of books that take place around the time of the Civil War and the years following. Both stories are told from multiple points of view, but the similarities end there.
Peter Matthiessen’s masterwork of fiction Shadow Country is a reworking of a book he wrote decades earlier, and which was originally split into three separate books. It tells the story of “Bloody Watson,” a real person who was suspected of a multitude of murders in southern Florida and who was gunned down by his neighbors after the great hurricane of October 1910. The first “book” is composed of a series of short chapters written in the voices of the people who were present when Watson was murdered, the second is from the perspective of his son, and the third is a first person accounting by Edgar Watson himself. It’s a great way to tell a story, not only because each section comes from a different perspective, but because each “author” lived a very different part of the same history. The accounts overlap, of course, but in ways that draw you into the mystery of Watson’s life and his family rather than simply telling the same tale from different angles.
For such a long book, it held my attention throughout, and involved places and times I’m really not all that familiar with. And knowing what little I do know about the Everglades region of Florida, it’s likely that there’s nothing left of the world Watson lived in. Most of that is a good thing—the relationship between the races and sexes was harsh and brutal—but it would be great to see what the Everglades looked like before much of the wildlife was shot out and the structure of the region was changed.
The second book I read this month is Chris Adrian’s first novel, Gob’s Grief. I read The Children’s Hospital in 2007, and came away wanting to read more from Adrian. Gob’s Grief isn’t as spectacular as The Children’s Hospital, but it covers a lot of the same ground; angels, spirits, life and death. And just like The Children’s Hospital, he somehow manages to keep the story grounded in reality.
A couple asides: the dog in the photo is Deuce, who finally figured out (last month) that sleeping on dog beds was better than sleeping on the floor. I tried setting the books next to him laying on a dog bed, but he couldn’t handle that. So that’s the best photo I could get with him and the books in it. Nika is out in the dog yard and the other dogs are at the races with Andrea today.
After looking at the list of books I read in past years on the sidebar, I realized that they were in chronological order, but reverse chronological order makes a lot more sense in the context of a blog (where the most recent post is first) and for the sidebar. So I reversed them with a quick Python script. Here’s my reverse.py:
#! /usr/bin/env python
import sys

lines = sys.stdin.readlines()
lines.reverse()
for line in lines:
    line = line.strip()
    print(line)
To use it: cat file | ./reverse.py > reversed_file